Climate ▸Forecast ▸February ▸March ▸
JanuaryFebruaryMarchAprilMayJuneJulyAugustSeptemberOctoberNovemberDecember

Average percent of sunshine in Villagrande

The mean percent of sunhours during the day in Villagrande (Marche), Italy.

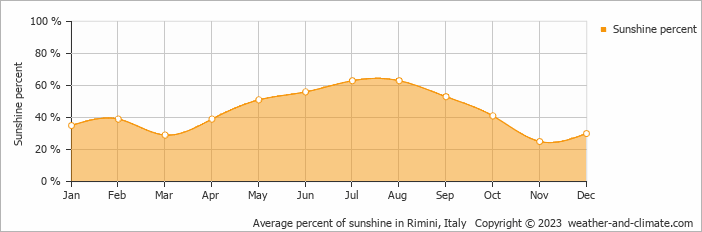
Data from: Rimini, Italy (29 KM, 18 Miles).
  • The sun shines on average 63.0% in August making it the most sunny month.
  • On average, November has the lowest percentage of sunshine with 25.0%.

Forecast: is it sunny in Villagrande?

Tuesday
25 Feb
Cloudy
Cloudy
9°C
0.2 mm
Wednesday
26 Feb
Rain
Rain
7°C
6 mm
Thursday
27 Feb
Light rain showers
Light rain showers
6°C
0.8 mm

Interested in more climate information?

This site provides you with all the information you need about the climate in Villagrande.

Our site offers climate and forecast data for every country in the world. Are you going to Italy? On this website you can find historical weather averages for many cities in Italy. Not sure yet where to go? We now have a tool which recommends destinations that suit your ideal travel conditions. Find out where to go with our weather planner.