ClimateForecastAprilMay >>

Average percent of sunshine in Urbania

The mean percent of sunhours during the day in Urbania (Marche), Italy.

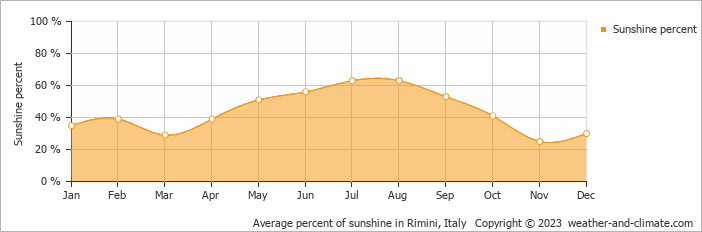
* Data from: Rimini, Italy (39 KM, 24 Miles).
  • The sun shines on average 63.0% in August making it the most sunny month.
  • On average, November has the lowest percentage of sunshine with 25.0%.

Weather Forecasts for Urbania

Mon   Apr 29
21°C | 11°C
NE 14 km/h
almost clear and no rain

almost clear and no rain

Tue   Apr 30
22°C | 11°C
NE 14 km/h
almost clear and no rain

almost clear and no rain

Wed   May 01
19°C | 10°C
E 11 km/h
11 mm
broken clouds and thunder

broken clouds and thunder

Interested in more climate information?

Weather and Climate provides you with all the information you need about the climate in Urbania.

Our site offers climate and forecast data for every country in the world. Are you going to Italy? On this website you can find historical weather averages for many cities in Italy. Not sure yet where to go? We now have a tool which recommends destinations that suit your ideal climate conditions. Find out where to go with our weather planner.