Average temperature in Villarrica
The mean minimum and maximum temperatures over the year in Villarrica (Araucanía), Chile.
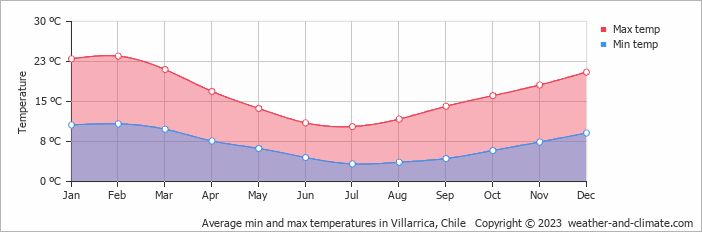
- The months of January, February, March and December have nice average temperatures.
- On average, the warmest month is February with 24°C.
- On average, the coolest month is July with 10°C.
- The average annual maximum temperature is 17°C.
- The average annual minimum temperature is 7°C.
Weather Forecasts for Villarrica
Fri Apr 26
10°C | 5°C
W  18 km/h
18 km/h16 mm
partly cloudy and rain
Sat Apr 27
10°C | 4°C
NW 18 km/h
18 km/h8.4 mm
broken clouds and rain
Sun Apr 28
11°C | 6°C
NW 22 km/h
22 km/h14 mm
overcast and heavy rain