Average temperature in Punta Rucia
The mean minimum and maximum temperatures over the year in Punta Rucia (Puerto Plata Province), the Dominican Republic.
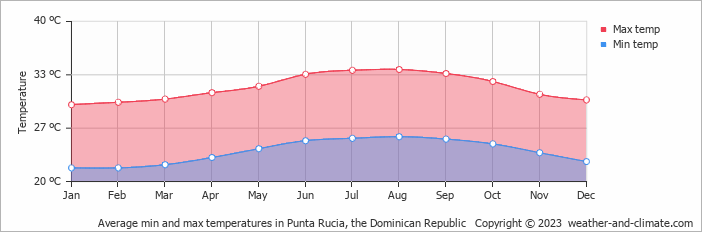
- The months of January and February have nice average temperatures.
- On average, the temperatures are always high.
- On average, the warmest month is August with 34°C.
- On average, the coolest month is January with 30°C.
- The average annual maximum temperature is 32°C.
- The average annual minimum temperature is 24°C.
Weather Forecasts for Punta Rucia
Fri Apr 26
29°C | 22°C
NE  18 km/h
18 km/h1.1 mm
broken clouds and rain
Sat Apr 27
29°C | 22°C
NE 22 km/h
22 km/h5.7 mm
broken clouds and rain
Sun Apr 28
29°C | 22°C
NE 29 km/h
29 km/h3.2 mm
partly cloudy and rain