Average temperature in Al Ḩamrāʼ
The mean minimum and maximum temperatures over the year in Al Ḩamrāʼ (), Oman.
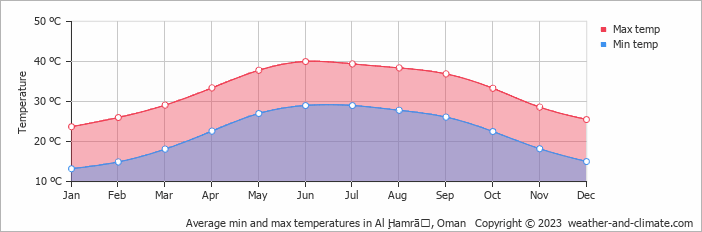
- The months of January, February, March, November and December have nice average temperatures.
- On average, the temperatures are always high.
- On average, the warmest month is June with 40°C.
- On average, the coolest month is January with 24°C.
- The average annual maximum temperature is 33°C.
- The average annual minimum temperature is 22°C.
Forecast for Al Ḩamrāʼ
Mon May 20
38°C | 25°C
S  14 km/h
14 km/hclear and no rain
Tue May 21
38°C | 23°C
S 14 km/h
14 km/hclear and no rain
Wed May 22
38°C | 23°C
S 14 km/h
14 km/hclear and no rain