Al бёЁamrДЃКј Climate by Month
The climate in Al бёЁamrДЃКј is marked by big temperature swings throughout the year.
Temperatures range from very hot during the warmest months
to warm in the cooler months.
The area is known for its low rainfall.
Now, let’s explore all the climate details to give you a full picture.
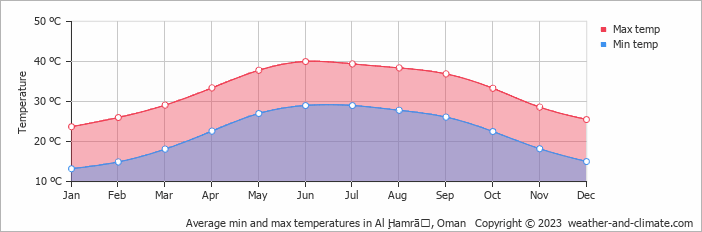
Average day and night temperature
In Al бёЁamrДЃКј, temperatures differ significantly between summer and winter months. Average daytime temperatures range from a very hot 40В°C in June, the warmest time of the year, to a comfortable 24В°C during cooler months like January. At night, temperatures typically average around 13В°C during these months.
The mean minimum and maximum temperatures throughout the year
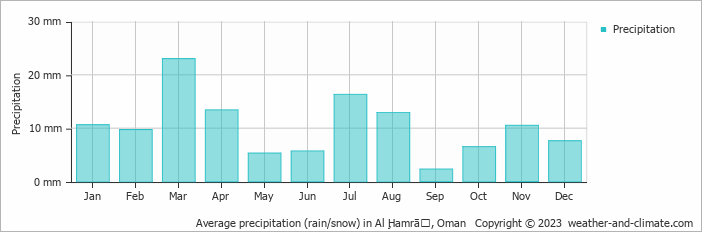
Precipitation and rainy days
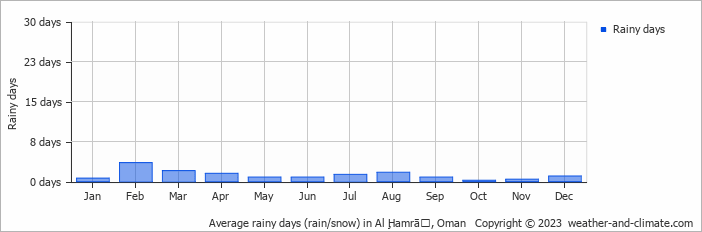
Al бёЁamrДЃКј sits in an arid zone with minimal moisture, averaging 124 mm of rainfall per year. Significant seasonal changes in precipitation occur throughout the year. During the wetter season, March receives low rainfall, averaging 23 mm of precipitation, recorded across 2 rainy days. In contrast, the drier season, September brings less rainfall, with 2.3 mm over a single rainy day.The mean monthly precipitation over the year, including rain, hail and snow
The average number of days each month with precipitation
The best time of year to visit Al бёЁamrДЃКј in Oman
During the months of January, February and December you are most likely to experience good weather with pleasant average temperatures that fall between 20В°C and 26В°C.Other facts from our historical weather data:
June has an average maximum temperature of 40В°C and is the warmest month of the year.
The coldest month is January with an average maximum temperature of 24В°C.
March tops the wettest month list with 23 mm of rainfall.
September is the driest month with 2 mm of precipitation.
No idea where to travel to this year? We have a tool that recommends destinations based on your ideal conditions. Find out where to go with our weather planner.