Vigonza Sunshine Hours by Month
Sunshine plays a big role in understanding the climate of a city. This page shows the total number of hours of direct sunlight per month and the average hours per day in Vigonza, Veneto, Italy. The numbers reflect climate data gathered over a 30-year period, from 1990 to 2020.
Monthly hours of sunshine
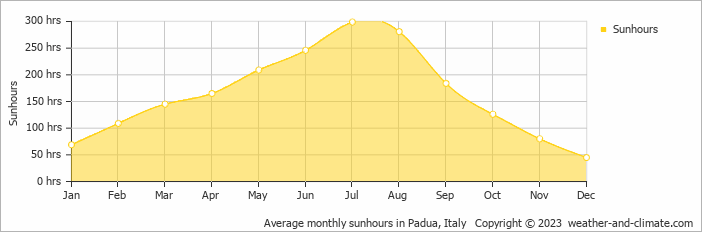
Sunshine in Vigonza varies greatly throughout the year. The sunniest month, July, reaches an impressive 299 hours, while December, the darkest month, offers only 45 hours. The total annual amount of sun is 1958 hours.
Daily hours of sunshine
For those who appreciate different seasons, Vigonza serves as an ideal destination. Expect longer, more sun-filled days in July with an average of 10.0 hours of sunshine daily, and embrace the darker days in December, offering only 1.5 hours of daily sunlight.
Vigonza vs Major Cities: Sunshine Compared
Vigonza enjoys an average of 1958 hours of sunshine annually. Let’s compare this with some popular tourist destinations:
Seville, Spain, enjoys an impressive 2920 hours of sunshine per year, making it an ideal destination even in winter.
Manchester, UK, experiences just around 1420 hours of sunshine annually.
Beijing, China, has 2505 hours of sunshine annually, with clear, sunny days in winter.
Adelaide, Australia, enjoys 2770 hours of sunshine annually, with long, sunny summers.
Related Climate Data for Vigonza
November, Vigonza’s wettest month, receives 66 mm (2.6 in) of rainfall and has a maximum daytime temperature of 14°C (57°F). During the driest month January you can expect a temperature of 9°C (48°F).
For more detailed insights into the city’s temperatures, check out our Temperature page. To explore more about precipitation patterns, visit our Vigonza Precipitation page.


