Urbania Sunshine Hours by Month
To truly understand a climate, we must look at its sunshine. This page shows the total number of hours of direct sunlight per month and the average hours per day in Urbania, Le Marche, Italy. The numbers reflect climate data gathered over a 30-year period, from 1990 to 2020.
Monthly hours of sunshine
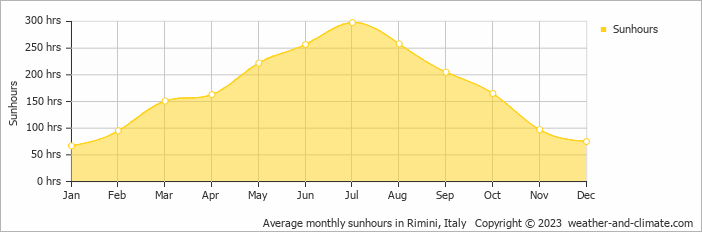
Seasonal sunshine in Urbania varies. It peaks at 298 hours in July and drops to 67 hours in January. The total annual amount of sun is 2053 hours.
Daily hours of sunshine
This means the city can be enjoyed more throughout the sunniest month of July under a blue sky, with approximately 9.9 hours of sunshine daily. In contrast, the city experiences much darker days in January, with only 2.2 hours of sunlight per day.
Average percent of sunshine
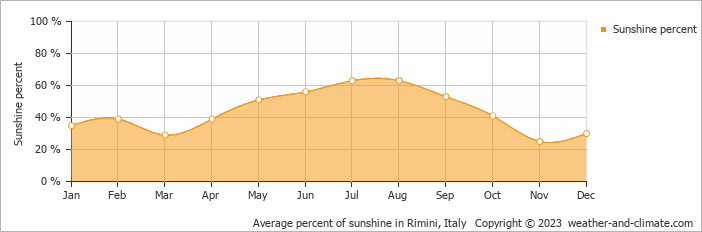
On average the sun shines 63% of the time during the day in August, the highest percentage of any month. November has the lowest percentage at 25%.
Urbania vs Major Cities: Sunshine Compared
Urbania enjoys an average of 2053 hours of sunshine annually. Let’s compare this with some popular tourist destinations:
Seville, Spain, enjoys an impressive 2920 hours of sunshine per year, making it an ideal destination even in winter.
In contrast, Juneau, Alaska, receives only about 1523 hours of sunshine per year and is known for its very short days in winter and frequently overcast conditions.
Osaka, Japan, experiences 2010 hours of sunshine annually, with bright, sunny weather in spring and autumn.
Melbourne, Australia, has 2380 hours of sunshine annually, with its famous “four seasons in a day” weather pattern.
Related Climate Data for Urbania
November, Urbania’s wettest month, receives 57 mm (2.2 in) of rainfall and has a maximum daytime temperature of 13°C (55°F). During the driest month July you can expect a temperature of 28°C (82°F).
For more detailed insights into the city’s temperatures, check out our Temperature page. To explore more about precipitation patterns, visit our Urbania Precipitation page.


