Santa Barbara (CA) Sunshine Hours by Month
When exploring climate, sunlight hours tell an important story. This page shows the total number of hours of direct sunlight per month and the average hours per day in Santa Barbara, California, United States of America. These averages rely on historical data collected over 30 years, from 1990 to 2020.
Monthly hours of sunshine
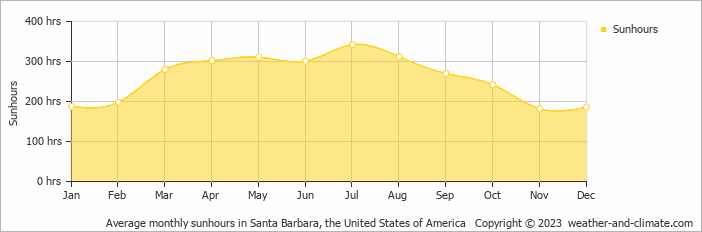
Seasonal sunshine in Santa Barbara varies. It peaks at 342 hours in July and drops to 182 hours in November. The total annual amount of sun is 3114 hours.
Daily hours of sunshine
Seasonal changes in sunshine hours are quite obvious in Santa Barbara. While July receives considerable daily sunshine with up to 11.4 hours, November marks the darkest time of the year, where sunshine is scarce with only 6.1 hours of sunlight per day.
Average percent of sunshine
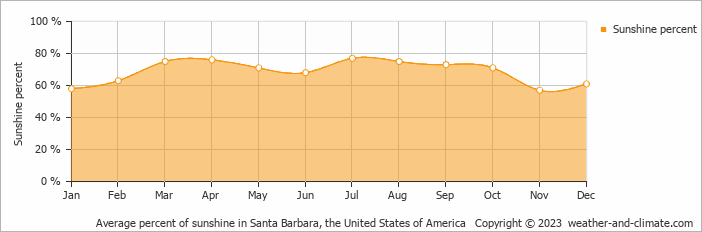
On average the sun shines 77% of the time during the day in July, the highest percentage of any month. November has the lowest percentage at 57%.
Santa Barbara vs Major Cities: Sunshine Compared
Santa Barbara enjoys an average of 3114 hours of sunshine annually. Let’s compare this with some popular tourist destinations:
In Lisbon, Portugal, there are approximately 2801 hours of sunshine annually, highlighting its warm and sunny Mediterranean climate.
Manchester, UK, experiences just around 1420 hours of sunshine annually.
Meanwhile, Buenos Aires, Argentina, enjoys a humid subtropical climate with 2520 hours of sunshine annually.
In Brisbane, Australia, the annual sunshine averages 2999 hours, making it one of Australia’s sunniest cities.
Related Climate Data for Santa Barbara
January, Santa Barbara’s wettest month, receives 1.4 mm (0.1 in) of rainfall and has a maximum daytime temperature of 19°C (66°F). During the driest month August you can expect a temperature of 24°C (75°F).
For more detailed insights into the city’s temperatures, check out our Temperature page. To explore more about precipitation patterns, visit our Santa Barbara Precipitation page.


