Greyton Weather & Climate: Best Time to Visit
Average temperatures, rainfall, sunshine and the best time to visit Greyton.
Climate overview of Greyton
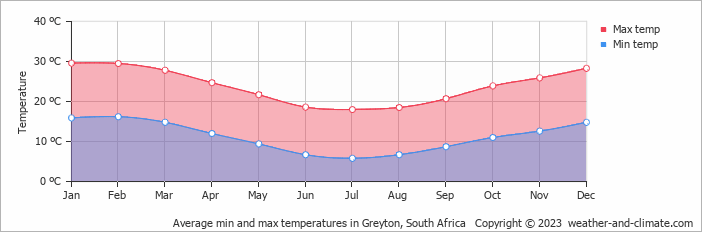
Greyton, Western Cape, South Africa, sees big temperature differences between seasons, with January peaking at 30°C (86°F) and July dropping to 18°C (64°F).
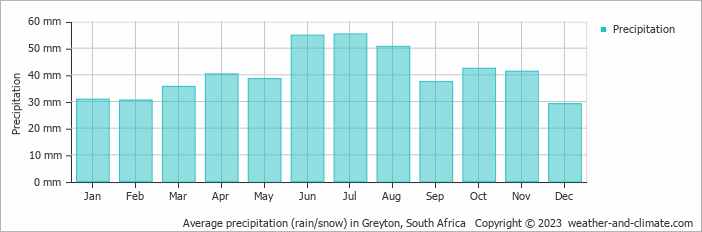
The city has a relatively dry climate, receiving around 487 mm (19 in) of rainfall per year. It does experience a distinct dry season from December to March, with warm summers and pleasant winters. July is the wettest month and December the driest.
Greyton Weather by Month
Pick a month to see the average temperature, rainfall and sunshine in Greyton - and find the best time to visit.
Monthly Temperature in Greyton
Visitors to Greyton can expect significant temperature changes throughout the year. On average, daytime temperatures range from a comfortable 30°C (86°F) in January to a pleasant 18°C (64°F) in July.
Nighttime temperatures range from 16°C (61°F) in January to 6°C (43°F) in July.
Check out our detailed temperature page for more information.
Temperature ranges by month
Rainfall in Greyton
Greyton tends toward drier weather patterns, receiving approximately 487 mm (19 in) of rain per year. The amount of precipitation varies moderately throughout the year. The wettest month, July, sees around 55 mm (2.2 in) of rainfall, perfect for those who enjoy a bit of rain now and then. The driest month, December, still receives a respectable 29 mm (1.1 in) of rainfall. For more details, please visit our Greyton Precipitation page.
The mean monthly precipitation over the year, including rain, hail, and snow
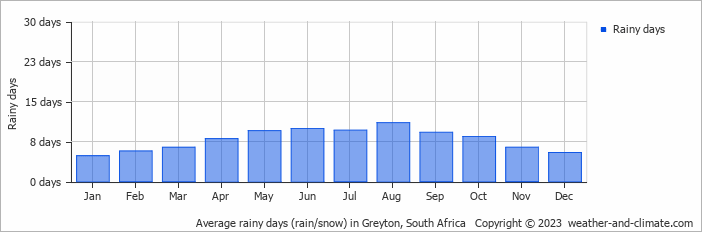
The average number of days each month with precipitation
Humidity in Greyton by Month
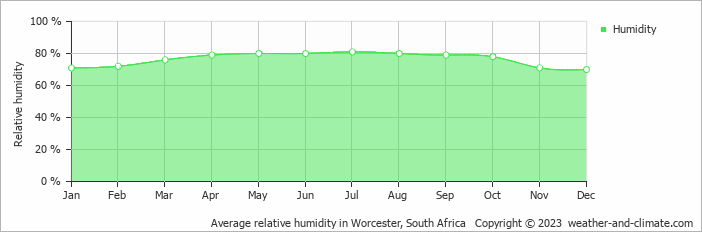
The relative humidity is high throughout the year in Greyton.
The city experiences its highest humidity in July, reaching 81%. In December, the humidity drops to its lowest level at 70%. What does this mean? Read our detailed page on humidity levels for further details.
Relative humidity over the year
Best Time to Visit Greyton
Monthly ratings reflect general weather comfort, based on daytime temperature and rainfall. Swimming and winter conditions are highlighted separately where relevant.
- Best overall: March, April, May, September, October, November and December
- Warmest weather: January, February and December
- Fewer rainy days: January, February, March, November and December
- Seasonal pattern: A distinct dry season from December to March, with warm summers and pleasant winters
Frequently asked questions about the climate in Greyton
What is the best time to visit Greyton?
March, April, May, September, October, November and December typically offer the most optimal weather in Greyton. In contrast, January and February tend to have less optimal conditions. Greyton has a distinct dry season from December to March, with warm summers and pleasant winters.
What temperatures can I expect in Greyton?
Daytime highs range from 18°C (64°F) in July to 30°C (86°F) in January. Nighttime lows range from 6°C (43°F) to 16°C (61°F). Temperatures vary considerably through the year.
How much rain does Greyton get?
Annual rainfall is around 487 mm (19 in). July is the wettest month with 55 mm (2.2 in), while December is the driest with 29 mm (1.1 in).
Greyton 3-Day Forecast
Greyton 3-Day Forecast
Greyton on the map
Greyton is highlighted - select any city to see its climate.
Popular this month
Where to go in July - average daytime high across popular destinations.
 Durban
 23°C (73°F) Pretoria
 21°C (70°F) Gqeberha20°C (68°F) Johannesburg20°C (68°F) Knysna19°C (66°F) Cape Town17°C (63°F) Hermanus
 17°C (63°F) Stellenbosch
 17°C (63°F)













Bucket list
Need travel inspiration? Check out our bucket list articles and be inspired.
Visit Kruger Park in South Africa
Are you going to South Africa, then you cannot skip the Kruger Park. The Kruger Park is one of the most beautiful and largest safari parks in the world.
One of South Africa's most spectacular private game reserves
Sabi Sand Game Reserve is one of South Africa's most spectacular private game reserves. The chance that you see the entire Big Five is high in winter (June - August).
Stay in the world's largest open-air gallery
Vast mountains, beautiful nature, tranquility and the possibility of hiking and seeing fascinating rock paintings. This can all be experienced at the Cederberg Mountains.
Kwazulu Natal
Countless beautiful landscapes, a colorful collection of cultures, wildlife parks, busy and deserted beaches, lively cities, small villages and a subtropical climate.