Baddi Sunshine Hours by Month
Sunshine is key to understanding how a place experiences its seasons. This page shows the total number of hours of direct sunlight per month and the average hours per day in Baddi, India. The figures are based on a 30-year period (1990–2020) to provide a reliable average.
Monthly hours of sunshine
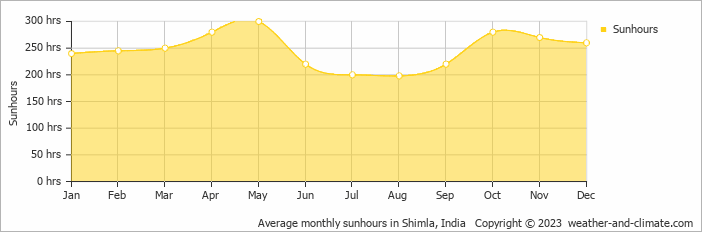
While the amount of sunshine in Baddi changes moderately throughout the year, the annual total remains impressive at around 2963 hours. Expect slightly brighter days in May and a subtle dip in August.
Daily hours of sunshine
This means you will experience moderate variation in sunshine hours throughout the year. With 10.0 hours daily sunshine in May, it dips to 6.6 hours in August.
Baddi vs Major Cities: Sunshine Compared
Baddi enjoys an average of 2963 hours of sunshine annually. Let’s compare this with some popular tourist destinations:
The city of Rome, Italy, experiences 2470 hours of sunshine annually, adding to its charm as a year-round tourist destination.
In contrast, Reykjavík, Iceland, receives only about 1330 hours of sunshine per year, known for its frequently overcast and rainy skies.
The climate in San Francisco, USA, includes 3072 hours of sunshine annually, thanks to its mild coastal weather.
In Tokyo, Japan, the average annual sunshine is 1930 hours, with sunny periods between rainy seasons.
Related Climate Data for Baddi
July, Baddi’s wettest month, receives 28 mm (1.1 in) of rainfall and has a maximum daytime temperature of 33°C (91°F). During the driest month November you can expect a temperature of 26°C (79°F).
For more detailed insights into the city’s temperatures, check out our Temperature page. To explore more about precipitation patterns, visit our Baddi Precipitation page.


