Saint John Weather & Climate: Best Time to Visit
Saint John, Saint John, US Virgin Islands, enjoys a steady climate throughout the year, with daytime temperatures typically around 28°C (82°F). September is the warmest month at 30°C (86°F), while February is the coolest at 27°C (81°F).
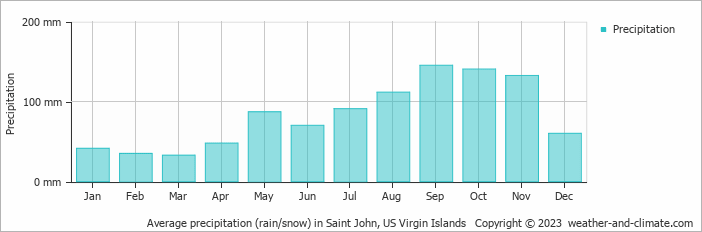
Annual rainfall is moderate at around 994 mm (39 in), with September being the wettest month. The city also has a distinct dry season from February to March.
Monthly Temperature in Saint John
The temperature in Saint John remains steady throughout the year, providing a consistently comfortable climate. Average daytime temperatures reach a comfortable 30°C (86°F) in September. In February, the coolest month of the year, temperatures drop to a comfortable 27°C (81°F).
At night, temperatures range from around 27°C (81°F) in September to 24°C (75°F) in February.
Check out our detailed temperature page for more information.
Temperature ranges by month

Rainfall in Saint John
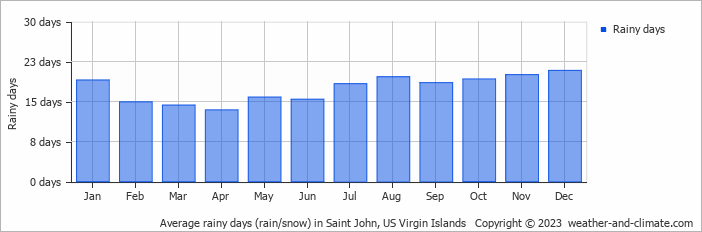
Generally, Saint John has a moderate amount of precipitation, averaging 994 mm (39 in) of rainfall annually. Saint John can be quite wet during September, receiving approximately 145 mm (5.7 in) of precipitation over 19 rainy days.
In contrast, during the driest month (March), you will experience much drier conditions, with 33 mm (1.3 in) of precipitation spread across 14 rainy days days. For more details, please visit our Saint John Precipitation page.
The mean monthly precipitation over the year, including rain, hail, and snow
The average number of days each month with precipitation
Saint John 3-Day Forecast
Check the conditions for any month of the year.
Best Time to Visit Saint John
Saint John has warm weather with temperatures ranging from 27°C (81°F) to 30°C (86°F) throughout the year. The best time to visit is during January, February, March and April, when rainfall is at its lowest, making it a great time for sightseeing and exploring all the place has to offer.For a more comfortable experience, start your day early when the weather is cooler, or take advantage of the gentle breezes in the late afternoon. Planning your next adventure but unsure where to go? Our climate tool suggests perfect locations tailored to your preferred weather conditions. Discover your ideal travel destination with our weather planner.


