Average monthly wind speed in Ciudad Bolívar
On this page you will find more information about the mean monthly wind speed over the year in Ciudad Bolívar (the Guyana Highlands), Venezuela.
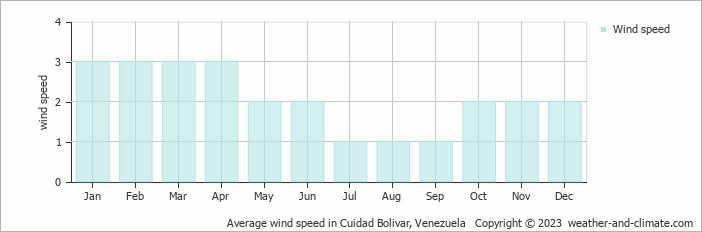
These figures come from monthly climatological averages showing that Ciudad Bolívar sees peak wind speeds of 3 m/s (6 knots) during its windiest period and minimum speeds of 1 m/s (2 knots) during its calmest season.
With an average of 1 m/s (2 knots) during July, August and September, the air remains quite still most of the time. Daily variations range from completely calm periods to gentle breezes reaching 3 m/s (6 knots). At this low average, you'll barely notice air movement against your face. Converting to other units, this equals 3.6 km/h or 2.2 mph.
Weather experts classify this as "light air" on the Beaufort scale. Smoke from chimneys rises almost straight up with minimal drift. Leaves typically stay motionless, though occasional light stirring may occur. These conditions create a relaxed atmosphere where wind seldom interferes with plans or comfort.The windiest period, January, February, March and April has average wind speeds of 3 m/s (6 knots). This means typical days feature moderate breezes that keep small branches moving. Air flow is consistent and noticeable. The speed translates to 10.8 kilometers per hour or 6.7 miles per hour. While some days are lighter, others may experience increased winds reaching 6 m/s (12 knots).
For more detailed information about Ciudad Bolívar’s weather, including monthly rainfall, sunshine hours, and humidity levels, visit our Ciudad Bolívar climate page.