Ciudad Bolívar Precipitation: Average Monthly Rainfall and Snowfall
This graph shows the average amount of rainfall per month in Ciudad Bolívar (the Guyana Highlands). The numbers are calculated over a 30-year period to provide a reliable average.
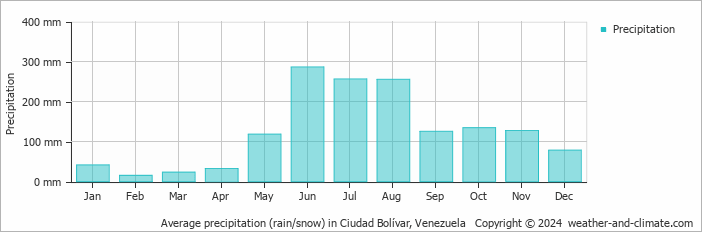
- A lot of rain (rainy season) falls in the months: May, June, July, August, September, October and November.
- Ciudad Bolívar has dry periods in February and March.
- On average, June is the wettest month with 286 mm of precipitation.
- On average, February is the driest month with 15 mm of precipitation.
- The average amount of annual precipitation is 1482 mm.
Current rainfall in Ciudad Bolívar
Fri Dec 13
35°C | 24°C
NE  14 km/h
14 km/h0.4 mm
partly cloudy and small chance of slight rain
Sat Dec 14
33°C | 24°C
NE 14 km/h
14 km/h3.3 mm
partly cloudy and rain
Sun Dec 15
35°C | 23°C
E 18 km/h
18 km/h0.2 mm
partly cloudy and chance of slight rain