Average monthly wind speed in Bayamon
Here you can view the typical wind conditions throughout the year in Bayamon, (North Puerto Rico), Puerto Rico.
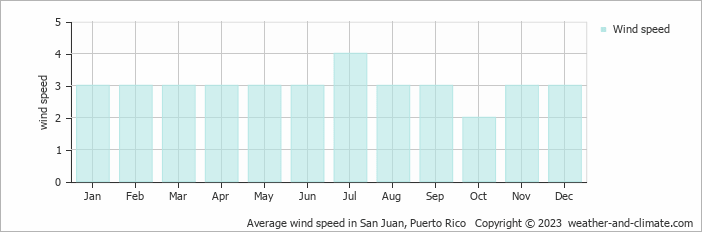
Wind speed in Bayamon varies across the year, ranging from 2 m/s (4 knots) to 4 m/s (8 knots).
An average wind speed of 2 m/s (4 knots) in October means a light breeze in Bayamon. This implies that on certain days, the air will be nearly still. There could also be higher gusts on other days. However on an average day, when it is 2 m/s (4 knots), you would feel a gentle caress of wind on your face and see leaves rustling. It's about 7.2 km/h or 4.5 mph on average. he wind conditions are generally mild enough to enjoy being outside throughout the month
Wind speeds reach an average of 4 m/s (8 knots) in July; this is the windiest time of the year. This means that on some days, the air is a strong breeze. There may still be stronger gusts or calmer moments, but windy conditions are the norm during this month.
For more detailed information about Bayamon’s weather, including monthly rainfall, sunshine hours, and humidity levels, visit our Bayamon climate page.


