Monthly Average Rainy days in Xiulin
The number of days each month with rain, snow and hail in Xiulin (Hualien County), Taiwan.
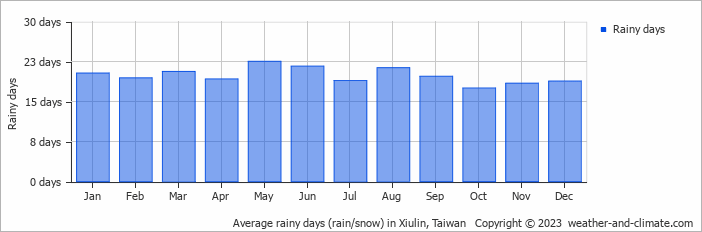
- Most rainy days are in January, February, March, April, May, June, July, August, September, October, November and December.
- On average, May is the most rainy with 22 days of rain/snow.
- On average, October is the driest month with 17 rainy days.
- The average annual number of rainy days is 238.
Current rainfall in Xiulin
Mon Jan 06
13°C | 6°C
E  2 m/s
2 m/s
2 m/s1.9 mm
broken clouds and small chance of rain
Tue Jan 07
9°C | 4°C
E 2 m/s
2 m/s1.9 mm
broken clouds and chance of rain
Wed Jan 08
10°C | 5°C
SE 2 m/s
2 m/s4.8 mm
broken clouds and rain


