Monthly Average Rainy days in Waterton Park
The number of days each month with rain, snow and hail in Waterton Park (Alberta), Canada.
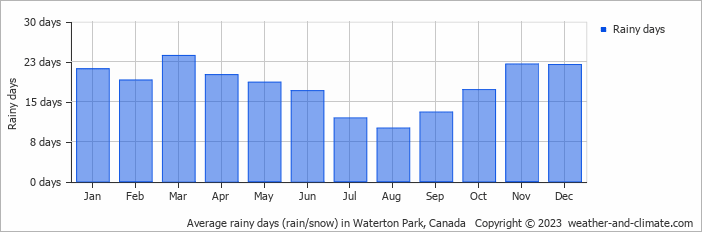
- Most rainy days are in January, February, March, April, May, June, October, November and December.
- On average, March is the most rainy with 23 days of rain/snow.
- On average, August is the driest month with 10 rainy days.
- The average annual number of rainy days is 215.
Current rainfall in Waterton Park
Fri Nov 22
-5°C | -13°C
NE  7 km/h
7 km/h15 mm
overcast and heavy snow
Sat Nov 23
-6°C | -17°C
E 4 km/h
4 km/h25 mm
overcast and heavy snow
Sun Nov 24
-8°C | -18°C
NE 4 km/h
4 km/h3.5 mm
overcast and slight snow