ClimateForecastAprilMay >>

Average monthly rainy days in Vladivostok

The number of days each month with rain, snow and hail in Vladivostok (Primorsky Krai), Russia.

Average monthly rainy days in Vladivostok,

Feel free to add this climate graph to your website. Click the copy button above.

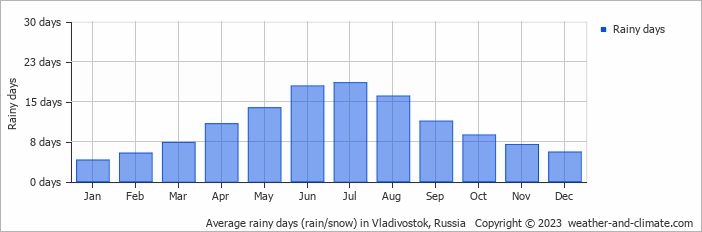
  • Most rainy days are in June, July and August.
  • On average, July is the most rainy with 18 days of rain/snow.
  • On average, January is the driest month with 4 rainy days.
  • The average annual number of rainy days is 125.

Weather Forecasts for Vladivostok

Fri   Apr 19
11°C | 4°C
S 18 km/h
partly cloudy and no rain

partly cloudy and no rain

Sat   Apr 20
15°C | 4°C
SW 14 km/h
broken clouds and no rain

broken clouds and no rain

Sun   Apr 21
11°C | 5°C
S 18 km/h
almost clear and no rain

almost clear and no rain

Interested in more climate information?

Weather and Climate provides you with all the information you need about the climate in Vladivostok.

Our site offers climate and forecast data for every country in the world. Are you going to Russia? On this website you can find historical weather averages for many cities in Russia. Not sure yet where to go? We now have a tool which recommends destinations that suit your ideal climate conditions. Find out where to go with our weather planner.