Average Rainy - Precipitation days in Vinderup
Vinderup in Midtjylland, Denmark, sees 180 days of precipitation annually, totaling to 867 mm of rain/snow. Learn more about it on this page.
Monthly Distribution of Rainy Days
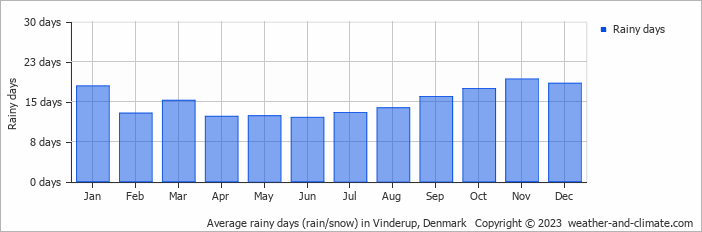
Precipitation peaks in August with 91 mm falling over 14 rainy days. The driest period is March, receiving 55 mm across 15 rainy days.
Amsterdam Precipitation Days Compared World Wide
On average, Vinderup receives over 180 days of precipitation annually. For comparison, here is some data from popular tourist destinations around the world:Las Vegas, USA, gets about 26 precipitation days annually, which is typical for its arid desert climate.
In Bogotá, Colombia, there are around 188 precipitation days annually, typical for its high-altitude tropical climate.
In Athens, Greece, it rains around 70 days in the year; therefore, it is one of the driest Mediterranean cities, mainly dominated by winter rainfall.
Boston, USA, experiences 134 precipitation days annually, including significant snow during winter.
Osaka, Japan, experiences 198 precipitation days annually, with wetter summers compared to winter.
Melbourne, Australia, has about 120 precipitation days annually, spread fairly evenly throughout the year.
Rain Facts From Around the Globe
Let’s explore more fascinating precipitation records:
- Tutunendo, Colombia, gets about 340 days of rain every year, which arguably makes it the wettest place in the world.
- On Réunion Island, a tropical cyclone generated 1825 mm in just 24 hours.
- Singapore receives thunder on 167 days in the year and is considered one of the most thunderous cities in the world.
- The smallest drops that fall are called drizzle drops, and they have a diameter of 0.5 mm.
- Some heavy storms generate "diamond dust," which consists of very small ice crystals that float in the air.
For more detailed information about rainfall patterns in Vinderup, visit our Rainfall & Precipitation page.
Current rainfall in Vinderup