Monthly Average Rainy days in Vigo di Cadore
The number of days each month with rain, snow and hail in Vigo di Cadore (Veneto), Italy.
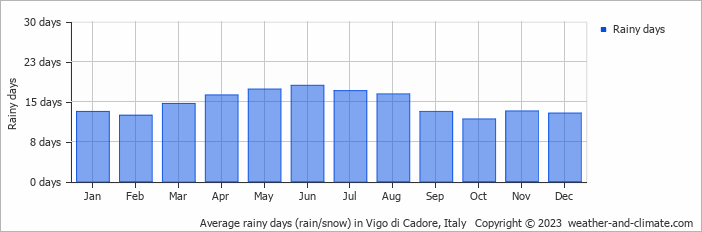
- Most rainy days are in April, May, June, July and August.
- On average, June is the most rainy with 18 days of rain/snow.
- On average, October is the driest month with 11 rainy days.
- The average annual number of rainy days is 175.
Current rainfall in Vigo di Cadore
Sun Dec 22
-1°C | -7°C
S  1 m/s
1 m/s
1 m/s8.4 mm
broken clouds and slight snow
Mon Dec 23
-1°C | -11°C
NW 2 m/s
2 m/salmost clear and no rain
Tue Dec 24
2°C | -4°C
NW 4 m/s
4 m/sbroken clouds and no rain


