Average Rainy - Precipitation days in Vedelago
Vedelago sees 124 days of precipitation annually, totaling to 1174 mm of rain/snow. Learn more about it on this page.
Monthly Distribution of Rainy Days
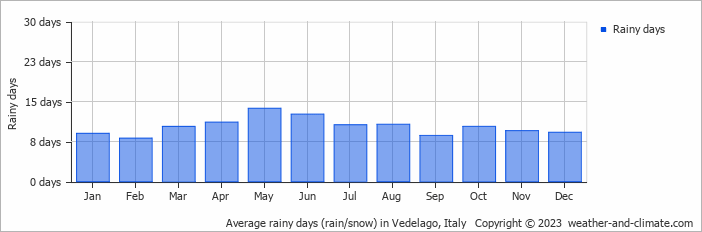
November is usually the wettest with 137 mm of rain over 10 rainy days, whereas January averages 62 mm during its 9 rainy days.
Amsterdam Precipitation Days Compared World Wide
On average, Vedelago receives over 124 days of precipitation annually. For comparison, here is some data from popular tourist destinations around the world:In Riyadh, Saudi Arabia, there are about 29 precipitation days annually, reflecting its dry desert environment.
In Bogotá, Colombia, there are around 188 precipitation days annually, typical for its high-altitude tropical climate.
In Lisbon, Portugal, there are an average of 113 precipitation days annually, characterized by wet winters and dry summers typical of the Mediterranean climate.
The climate in San Francisco, USA, sees around 70 precipitation days annually, mostly during the winter months.
In Shanghai, China, there are approximately 147 precipitation days per year, with a humid subtropical climate.
In Tokyo, Japan, the city sees around 181 precipitation days annually, with significant summer rains due to typhoon season.
Rain Facts From Around the Globe
Let’s explore more fascinating precipitation records:
- Tutunendo, Colombia, gets about 340 days of rain every year, which arguably makes it the wettest place in the world.
- On RĂ©union Island, a tropical cyclone generated 1825 mm in just 24 hours.
- Singapore receives thunder on 167 days in the year and is considered one of the most thunderous cities in the world.
- The smallest drops that fall are called drizzle drops, and they have a diameter of 0.5 mm.
- Some heavy storms generate "diamond dust," which consists of very small ice crystals that float in the air.
For more detailed information about rainfall patterns in Vedelago, visit our Rainfall & Precipitation page.
Current rainfall in Vedelago


