Monthly Average Rainy days in Trimbak
The number of days each month with rain, snow and hail in Trimbak (Maharashtra), India.
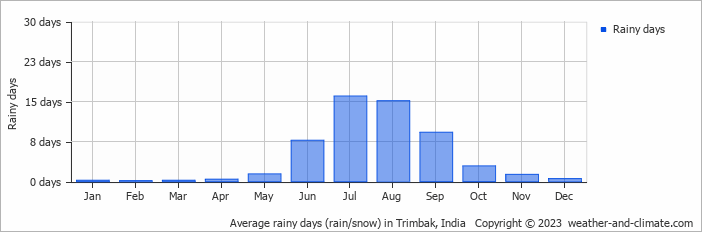
- Most rainy days are in July and August.
- Trimbak has dry periods in January, February, March, April, May, November and December.
- On average, July is the most rainy with 16 days of rain/snow.
- On average, February is the driest month with 0 rainy days.
- The average annual number of rainy days is 54.
Current rainfall in Trimbak
Sun Nov 17
31°C | 19°C
E  18 km/h
18 km/halmost clear and no rain
Mon Nov 18
30°C | 18°C
E 14 km/h
14 km/hclear and no rain
Tue Nov 19
29°C | 17°C
E 18 km/h
18 km/halmost clear and no rain


