Monthly Average Rainy days in The Waterberg Biosphere
The number of days each month with rain, snow and hail in The Waterberg Biosphere (), South Africa.
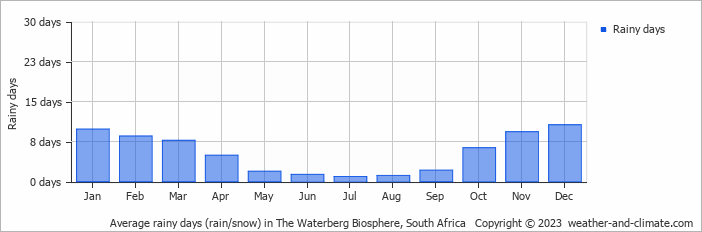
- The Waterberg Biosphere has dry periods in May, June, July and August.
- On average, December is the most rainy with 10 days of rain/snow.
- On average, July is the driest month with 0 rainy days.
- The average annual number of rainy days is 64.
Current rainfall in The Waterberg Biosphere
Mon Jan 06
26°C | 19°C
N  3 m/s
3 m/s
3 m/s7.5 mm
broken clouds and rain
Tue Jan 07
26°C | 19°C
NE 6 m/s
6 m/s7 mm
partly cloudy and rain
Wed Jan 08
25°C | 18°C
S 3 m/s
3 m/s11 mm
broken clouds and thunder


