The Waterberg Biosphere Weather & Climate: Best Time to Visit
Average temperatures, rainfall, sunshine and the best time to visit The Waterberg Biosphere.
Climate overview of The Waterberg Biosphere
The Waterberg Biosphere, South Africa, experiences moderate temperature changes through the seasons. October is the warmest month with daytime highs of 30°C (86°F), while July is the coolest at 22°C (72°F).
Annual rainfall is moderate at around 534 mm (21 in), with January being the wettest month. The city also has a distinct dry season from April to October.
The Waterberg Biosphere Weather by Month
Pick a month to see the average temperature, rainfall and sunshine in The Waterberg Biosphere — and find the best time to visit.
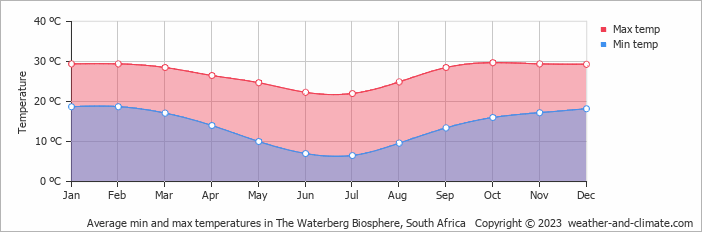
Monthly Temperature in The Waterberg Biosphere
The weather in The Waterberg Biosphere changes moderately throughout the year, offering enough variation to appreciate each season. Average daytime temperatures reach a comfortable 30°C (86°F) in October. In July, the coolest month of the year, temperatures drop to a comfortable 22°C (72°F).
At night, temperatures range from around 19°C (66°F) in October to 7°C (45°F) in July.
Check out our detailed temperature page for more information.
Temperature ranges by month
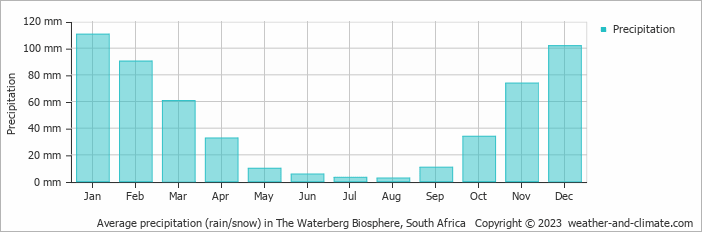
Rainfall in The Waterberg Biosphere
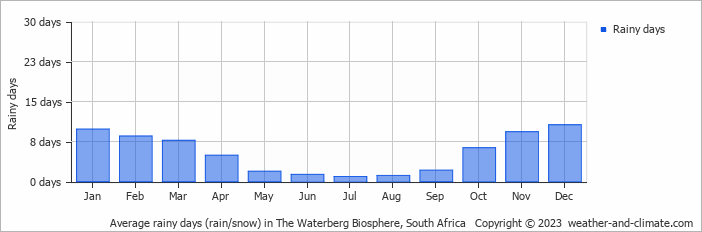
Generally, The Waterberg Biosphere has a moderate amount of precipitation, averaging 534 mm (21 in) of rainfall annually. The Waterberg Biosphere can be quite wet during January, receiving approximately 110 mm (4.3 in) of precipitation over 10 rainy days.
In contrast, during the driest month (August), you will experience much drier conditions, with 2.5 mm (0.1 in) of precipitation spread across a single rainy day days. For more details, please visit our The Waterberg Biosphere Precipitation page.
The mean monthly precipitation over the year, including rain, hail, and snow
The average number of days each month with precipitation
Best Time to Visit The Waterberg Biosphere
Rainfall during this time ranges from 3 mm (0.1 in) in August to 33 mm (1.3 in) in April. This means you can expect a mix of sunny days and occasional showers. Ready to plan your travels but need destination ideas? Our smart tool recommends places based on the climate conditions you prefer. Start planning with our destination weather tool.
Frequently asked questions about the climate in The Waterberg Biosphere
What is the best time to visit The Waterberg Biosphere?
February, March, April, May, June, July, August, September and November typically offer the most optimal weather in The Waterberg Biosphere. In contrast, October tends to have less optimal conditions. The Waterberg Biosphere has a distinct dry season from April to October.
What temperatures can I expect in The Waterberg Biosphere?
Daytime highs range from 22°C (72°F) in July to 30°C (86°F) in October. Nighttime lows range from 7°C (45°F) to 19°C (66°F).
How much rain does The Waterberg Biosphere get?
Annual rainfall is around 534 mm (21 in). January is the wettest month with 110 mm (4.3 in), while August is the driest with 2.5 mm (0.1 in).
The Waterberg Biosphere 3-Day Forecast
The Waterberg Biosphere 3-Day Forecast
The Waterberg Biosphere on the map
The Waterberg Biosphere is highlighted — select any city to see its climate.
Popular this month
Where to go in July — average daytime high across popular destinations.
Bucket list
Need travel inspiration? Check out our bucket list articles and be inspired.
 Visit Kruger Park in South Africa
Are you going to South Africa, then you cannot skip the Kruger Park. The Kruger Park is one of the most beautiful and largest safari parks in the world.
One of South Africa's most spectacular private game reserves
Sabi Sand Game Reserve is one of South Africa's most spectacular private game reserves. The chance that you see the entire Big Five is high in winter (June - August).
Stay in the world's largest open-air gallery
Vast mountains, beautiful nature, tranquility and the possibility of hiking and seeing fascinating rock paintings. This can all be experienced at the Cederberg Mountains.
Kwazulu Natal
Countless beautiful landscapes, a colorful collection of cultures, wildlife parks, busy and deserted beaches, lively cities, small villages and a subtropical climate.