Average Rainy - Precipitation days in Tavoleto
With 138 days and 898 mm of annual rain, Tavoleto has a moderate precipitation pattern. On this page, you can learn everything about the number of precipitation days.
Monthly Distribution of Rainy Days
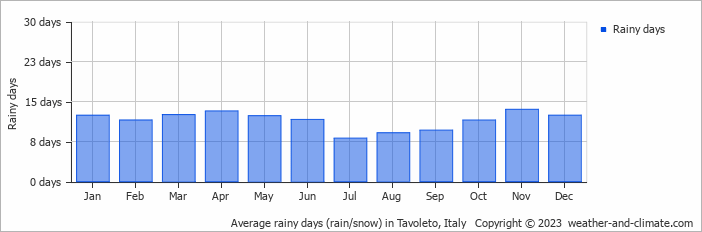
November is usually the wettest with 98 mm of rain over 14 rainy days, whereas July averages 43 mm during its 8 rainy days.
Amsterdam Precipitation Days Compared World Wide
On average, Tavoleto receives over 138 days of precipitation annually. For comparison, here is some data from popular tourist destinations around the world:In Cairo, Egypt, there are only about 16 precipitation days annually, making it one of the driest capitals in the world.
In Bogotá, Colombia, there are around 188 precipitation days annually, typical for its high-altitude tropical climate.
Seville, Spain, experiences 103 precipitation days annually, with wet winters and dry summers typical of southern Spain.
In Toronto, Canada, there are about 126 precipitation days per year, with snowfall occurring in winter and rainfall in summer.
In Seoul, South Korea, the city experiences 106 precipitation days annually, with most rain falling during the summer monsoon season.
In Brisbane, Australia, the city averages 123 precipitation days per year, making it wetter than Sydney.
Rain Facts From Around the Globe
Let’s explore more fascinating precipitation records:
- Tutunendo, Colombia, gets about 340 days of rain every year, which arguably makes it the wettest place in the world.
- On Réunion Island, a tropical cyclone generated 1825 mm in just 24 hours.
- Singapore receives thunder on 167 days in the year and is considered one of the most thunderous cities in the world.
- The smallest drops that fall are called drizzle drops, and they have a diameter of 0.5 mm.
- Some heavy storms generate "diamond dust," which consists of very small ice crystals that float in the air.
For more detailed information about rainfall patterns in Tavoleto, visit our Rainfall & Precipitation page.
Current rainfall in Tavoleto


