ClimateForecastAprilMay >>

Average monthly rainy days in Tarquinia

The number of days each month with rain, snow and hail in Tarquinia (Lazio), Italy.

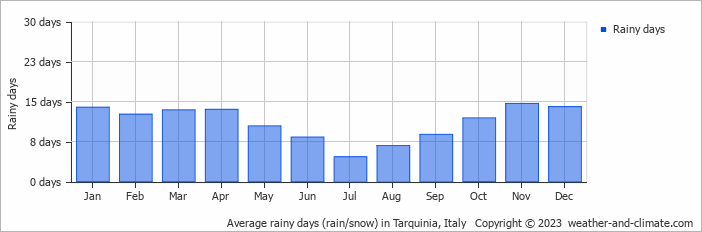
  • On average, November is the most rainy with 14 days of rain/snow.
  • On average, July is the driest month with 4 rainy days.
  • The average annual number of rainy days is 132.

Weather Forecasts for Tarquinia

Fri   Apr 26
17°C | 8°C
S 22 km/h
2.1 mm
partly cloudy and small chance of slight rain

partly cloudy and small chance of slight rain

Sat   Apr 27
20°C | 11°C
S 25 km/h
2.4 mm
partly cloudy and  chance of slight rain

partly cloudy and chance of slight rain

Sun   Apr 28
23°C | 8°C
SW 14 km/h
partly cloudy and no rain

partly cloudy and no rain

Interested in more climate information?

Weather and Climate provides you with all the information you need about the climate in Tarquinia.

Our site offers climate and forecast data for every country in the world. Are you going to Italy? On this website you can find historical weather averages for many cities in Italy. Not sure yet where to go? We now have a tool which recommends destinations that suit your ideal climate conditions. Find out where to go with our weather planner.