ClimateForecastMayJune >>

Average monthly rainy days in Tapovan

The number of days each month with rain, snow and hail in Tapovan (Uttarakhand), India.

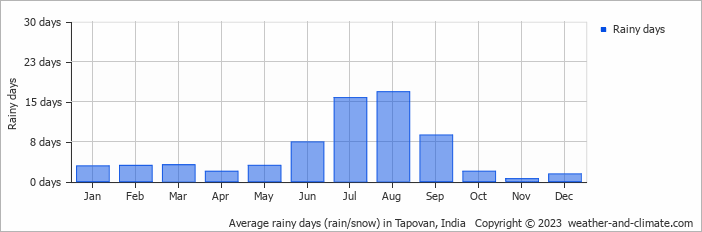
  • Most rainy days are in July and August.
  • Tapovan has dry periods in April, October, November and December.
  • On average, August is the most rainy with 16 days of rain/snow.
  • On average, November is the driest month with 0 rainy days.
  • The average annual number of rainy days is 66.

Forecast for Tapovan

Sat   May 25
39°C | 27°C
SW 11 km/h
0.3 mm
partly cloudy and small chance of slight rain

partly cloudy and small chance of slight rain

Sun   May 26
40°C | 27°C
SW 11 km/h
clear and no rain

clear and no rain

Mon   May 27
40°C | 26°C
SW 11 km/h
clear and no rain

clear and no rain

Interested in more climate information?

This site provides you with all the information you need about the climate in Tapovan.

Our site offers climate and forecast data for every country in the world. Are you going to India? On this website you can find historical weather averages for many cities in India. Not sure yet where to go? We now have a tool which recommends destinations that suit your ideal climate conditions. Find out where to go with our weather planner.