ClimateForecastAprilMay >>

Average monthly rainy days in Taling Ngam Beach

The number of days each month with rain, snow and hail in Taling Ngam Beach (Koh Samui), Thailand.

Average monthly rainy days in Taling Ngam Beach,

Feel free to add this climate graph to your website. Click the copy button above.

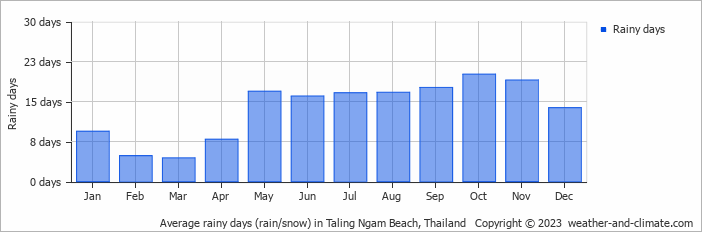
  • Most rainy days are in May, June, July, August, September, October and November.
  • On average, October is the most rainy with 20 days of rain/snow.
  • On average, March is the driest month with 4 rainy days.
  • The average annual number of rainy days is 163.

Weather Forecasts for Taling Ngam Beach

Fri   Apr 19
36°C | 28°C
S 7 km/h
almost clear and no rain

almost clear and no rain

Sat   Apr 20
35°C | 28°C
SE 7 km/h
1.5 mm
partly cloudy and  chance of rain

partly cloudy and chance of rain

Sun   Apr 21
36°C | 27°C
W 11 km/h
2 mm
partly cloudy and rain

partly cloudy and rain

Interested in more climate information?

Weather and Climate provides you with all the information you need about the climate in Taling Ngam Beach.

Our site offers climate and forecast data for every country in the world. Are you going to Thailand? On this website you can find historical weather averages for many cities in Thailand. Not sure yet where to go? We now have a tool which recommends destinations that suit your ideal climate conditions. Find out where to go with our weather planner.