ClimateForecastAprilMay >>

Average monthly rainy days in Taichung

The number of days each month with rain, snow and hail in Taichung (Taichung Municipality), Taiwan.

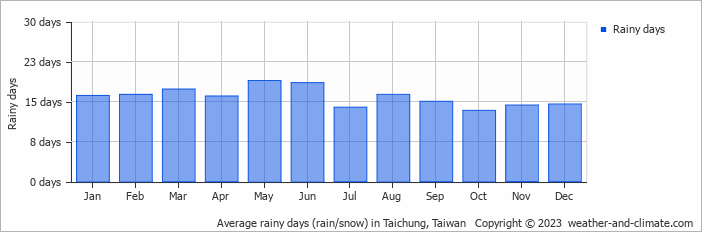
  • Most rainy days are in January, February, March, April, May, June, August and September.
  • On average, May is the most rainy with 18 days of rain/snow.
  • On average, October is the driest month with 13 rainy days.
  • The average annual number of rainy days is 190.

Weather Forecasts for Taichung

Sun   Apr 28
28°C | 21°C
SE 18 km/h
14 mm
broken clouds and rain

broken clouds and rain

Mon   Apr 29
31°C | 22°C
SW 18 km/h
1.1 mm
partly cloudy and  chance of rain

partly cloudy and chance of rain

Tue   Apr 30
31°C | 22°C
SW 22 km/h
2.8 mm
partly cloudy and thunder

partly cloudy and thunder

Interested in more climate information?

Weather and Climate provides you with all the information you need about the climate in Taichung.

Our site offers climate and forecast data for every country in the world. Are you going to Taiwan? On this website you can find historical weather averages for many cities in Taiwan. Not sure yet where to go? We now have a tool which recommends destinations that suit your ideal climate conditions. Find out where to go with our weather planner.