Average Rainy - Precipitation days in Tabashka
With 107 days and 918 mm of annual rain/snow, Tabashka has a moderate precipitation pattern. On this page, you can learn everything about the number of precipitation days.
Monthly Distribution of Rainy Days
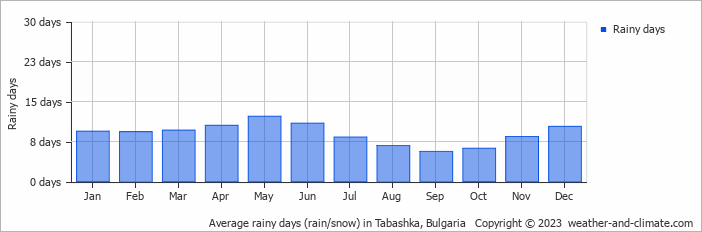
The wettest month is May, with 12 rainy days bringing 118 mm of rain. In contrast, November sees 8 rainy days with 54 mm of rain.
Amsterdam Precipitation Days Compared World Wide
On average, Tabashka receives over 107 days of precipitation annually. For comparison, here is some data from popular tourist destinations around the world:In Riyadh, Saudi Arabia, there are about 29 precipitation days annually, reflecting its dry desert environment.
In Bogotá, Colombia, there are around 188 precipitation days annually, typical for its high-altitude tropical climate.
The city of Rome, Italy, averages 131 precipitation days annually, spread fairly evenly throughout the year.
In Toronto, Canada, there are about 126 precipitation days per year, with snowfall occurring in winter and rainfall in summer.
Buenos AiresBuenos Aires, Argentina, has around 92 precipitation days annually, mostly during the summer months.
In Tokyo, Japan, the city sees around 181 precipitation days annually, with significant summer rains due to typhoon season.
Fun facts about Rain from Around the World
Let’s explore more fascinating precipitation records:
- Tutunendo, Colombia, gets about 340 days of rain every year, which arguably makes it the wettest place in the world.
- On Réunion Island, a tropical cyclone generated 1825 mm in just 24 hours.
- Singapore receives thunder on 167 days in the year and is considered one of the most thunderous cities in the world.
- The smallest drops that fall are called drizzle drops, and they have a diameter of 0.5 mm.
- Some heavy storms generate "diamond dust," which consists of very small ice crystals that float in the air.
For more detailed information about rainfall patterns in Tabashka, visit our Rainfall & Precipitation page.
Current rainfall in Tabashka