Average Rainy - Precipitation days in Sønder Vorupør
With 187 days and 913 mm of annual rain/snow, Sønder Vorupør has a moderate precipitation pattern. On this page, you can learn everything about the number of precipitation days.
Monthly Distribution of Rainy Days
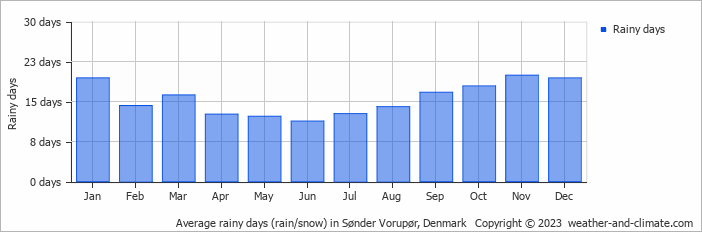
Precipitation peaks in October with 104 mm falling over 18 rainy days. The driest period is April, receiving 51 mm across 13 rainy days.
Amsterdam Precipitation Days Compared World Wide
Sønder Vorupør's average annual precipitation falls over 187 days. Let's compare this to some popular worldwide tourist destinations:
Las Vegas, USA, gets about 26 precipitation days annually, which is typical for its arid desert climate.
Singapore, Singapore, records about 175 precipitation days per year, with rain spread fairly evenly throughout the year.
In Lisbon, Portugal, there are an average of 113 precipitation days annually, characterized by wet winters and dry summers typical of the Mediterranean climate.
Chicago, USA, has 133 precipitation days annually, with a mix of rain and snow.
Beijing, China, averages 72 precipitation days annually, concentrated in the summer months.
In Brisbane, Australia, the city averages 123 precipitation days per year, making it wetter than Sydney.
Rain Facts From Around the Globe
Let’s explore more fascinating precipitation records:
- Tutunendo, Colombia, gets about 340 days of rain every year, which arguably makes it the wettest place in the world.
- On Réunion Island, a tropical cyclone generated 1825 mm in just 24 hours.
- Singapore receives thunder on 167 days in the year and is considered one of the most thunderous cities in the world.
- The smallest drops that fall are called drizzle drops, and they have a diameter of 0.5 mm.
- Some heavy storms generate "diamond dust," which consists of very small ice crystals that float in the air.
For more detailed information about rainfall patterns in Sønder Vorupør, visit our Rainfall & Precipitation page.
Current rainfall in Sønder Vorupør


