Monthly Average Rainy days in Sharurah
The number of days each month with rain, snow and hail in Sharurah (Najran Province), Saudi Arabia.
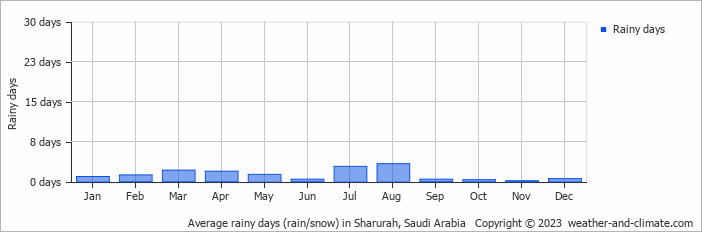
- Sharurah has dry periods in January, February, April, May, June, September, October, November and December.
- On average, August is the most rainy with 3 days of rain/snow.
- On average, November is the driest month with 0 rainy days.
- The average annual number of rainy days is 15.
Current rainfall in Sharurah
Tue Jan 14
23°C | 13°C
E  5 m/s
5 m/s
5 m/sclear and no rain
Wed Jan 15
22°C | 11°C
NE 4 m/s
4 m/sclear and no rain
Thu Jan 16
25°C | 9°C
NE 3 m/s
3 m/sclear and no rain


