Monthly Average Rainy days in San Marcos (CA)
The number of days each month with rain, snow and hail in San Marcos (California), the United States of America.
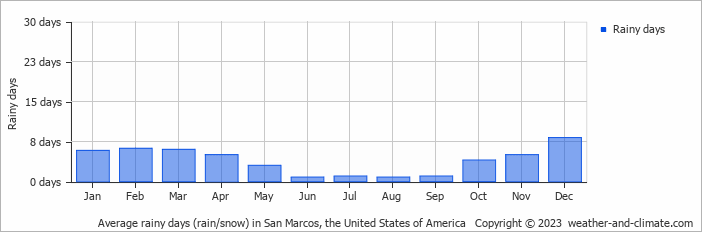
- San Marcos has dry periods in June, July, August and September.
- On average, December is the most rainy with 8 days of rain/snow.
- On average, August is the driest month with 0 rainy days.
- The average annual number of rainy days is 47.
Current rainfall in San Marcos (CA)
Sat Dec 28
16°C | 9°C
W  3 m/s
3 m/s
3 m/sbroken clouds and no rain
Sun Dec 29
16°C | 9°C
W 3 m/s
3 m/salmost clear and no rain
Mon Dec 30
16°C | 8°C
W 3 m/s
3 m/sclear and no rain


