Monthly Average Rainy days in San José del Sur
The number of days each month with rain, snow and hail in San José del Sur (), Nicaragua.
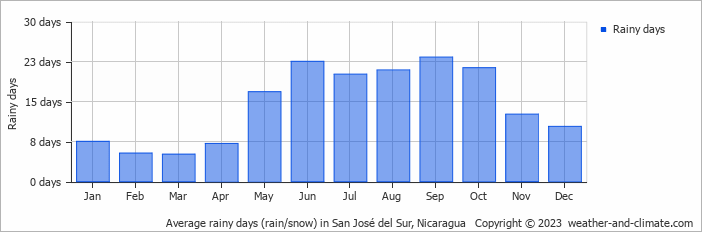
- Most rainy days are in May, June, July, August, September and October.
- On average, September is the most rainy with 23 days of rain/snow.
- On average, March is the driest month with 5 rainy days.
- The average annual number of rainy days is 172.
Current rainfall in San José del Sur
Tue Jan 28
30°C | 24°C
NE  10 m/s
10 m/s1 mm
broken clouds and rain
Wed Jan 29
29°C | 24°C
NE 9 m/s
9 m/s0.5 mm
broken clouds and chance of slight rain
Thu Jan 30
29°C | 24°C
NE 9 m/s
9 m/s1.4 mm
partly cloudy and rain