Monthly Average Rainy days in San Giorgio
The number of days each month with rain, snow and hail in San Giorgio (), Italy.
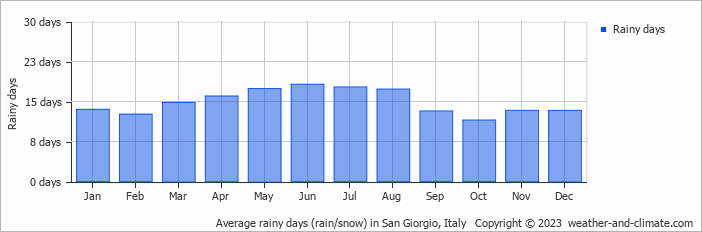
- Most rainy days are in April, May, June, July and August.
- On average, June is the most rainy with 18 days of rain/snow.
- On average, October is the driest month with 11 rainy days.
- The average annual number of rainy days is 178.
Current rainfall in San Giorgio
Sun Dec 22
0°C | -5°C
NW  1 m/s
1 m/s
1 m/s10 mm
overcast and heavy snow
Mon Dec 23
0°C | -7°C
W 1 m/s
1 m/s0.5 mm
broken clouds and slight snow
Tue Dec 24
2°C | -5°C
NW 2 m/s
2 m/s1.6 mm
overcast and snow


