Monthly Average Rainy days in Rocca Pietore
The number of days each month with rain, snow and hail in Rocca Pietore (Veneto), Italy.
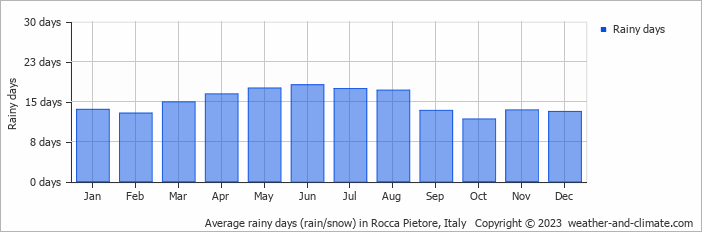
- Most rainy days are in April, May, June, July and August.
- On average, June is the most rainy with 18 days of rain/snow.
- On average, October is the driest month with 11 rainy days.
- The average annual number of rainy days is 179.
Current rainfall in Rocca Pietore
Fri Jan 10
3°C | -6°C
NW  2 m/s
2 m/s
2 m/sbroken clouds and no rain
Sat Jan 11
-1°C | -13°C
NW 2 m/s
2 m/sclear and no rain
Sun Jan 12
-2°C | -14°C
NW 3 m/s
3 m/sclear and no rain


