ClimateForecastMayJune >>

Average monthly rainy days in Riva di Tures

The number of days each month with rain, snow and hail in Riva di Tures (Trentino Alto Adige), Italy.

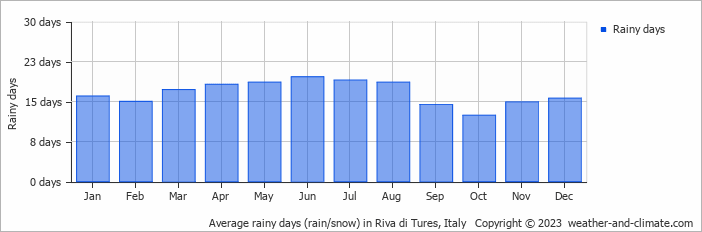
  • Most rainy days are in January, February, March, April, May, June, July, August and December.
  • On average, June is the most rainy with 19 days of rain/snow.
  • On average, October is the driest month with 12 rainy days.
  • The average annual number of rainy days is 199.

Weather Forecasts for Riva di Tures

Wed   May 01
13°C | 3°C
SE 11 km/h
broken clouds and no rain

broken clouds and no rain

Thu   May 02
7°C | 0°C
S 14 km/h
3.2 mm
broken clouds and rain

broken clouds and rain

Fri   May 03
5°C | -1°C
N 7 km/h
12 mm
overcast and sleet

overcast and sleet

Interested in more climate information?

Weather and Climate provides you with all the information you need about the climate in Riva di Tures.

Our site offers climate and forecast data for every country in the world. Are you going to Italy? On this website you can find historical weather averages for many cities in Italy. Not sure yet where to go? We now have a tool which recommends destinations that suit your ideal climate conditions. Find out where to go with our weather planner.