Monthly Average Rainy days in Port Orchard (WA)
The number of days each month with rain, snow and hail in Port Orchard (Washington State), the United States of America.
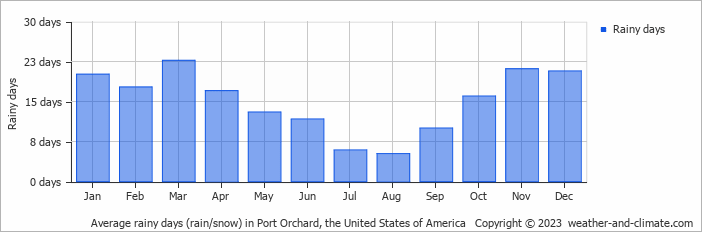
- Most rainy days are in January, February, March, April, October, November and December.
- On average, March is the most rainy with 22 days of rain/snow.
- On average, August is the driest month with 5 rainy days.
- The average annual number of rainy days is 181.
Current rainfall in Port Orchard (WA)
Sat Dec 28
10°C | 5°C
SW  7 m/s
7 m/s
7 m/s4.4 mm
broken clouds and rain
Sun Dec 29
7°C | 3°C
SW 4 m/s
4 m/s4.2 mm
overcast and heavy rain
Mon Dec 30
8°C | 2°C
SW 5 m/s
5 m/spartly cloudy and no rain


