Monthly Average Rainy days in Playa Hermosa
The number of days each month with rain, snow and hail in Playa Hermosa (Guanacaste), Costa Rica.
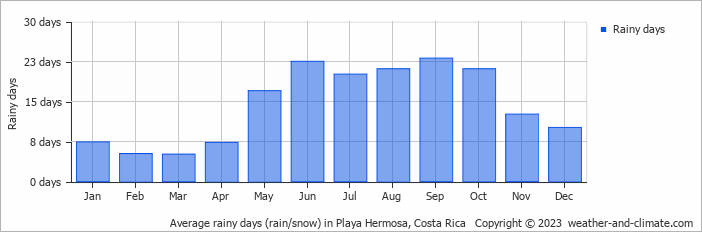
- Most rainy days are in May, June, July, August, September and October.
- On average, September is the most rainy with 23 days of rain/snow.
- On average, March is the driest month with 5 rainy days.
- The average annual number of rainy days is 172.
Current rainfall in Playa Hermosa
Sun Dec 15
31°C | 23°C
NE  18 km/h
18 km/halmost clear and no rain
Mon Dec 16
31°C | 22°C
E 7 km/h
7 km/h0.3 mm
partly cloudy and small chance of slight rain
Tue Dec 17
31°C | 22°C
NE 11 km/h
11 km/h0.5 mm
partly cloudy and chance of slight rain