Monthly Average Rainy days in Playa Conchal
The number of days each month with rain, snow and hail in Playa Conchal (Guanacaste), Costa Rica.
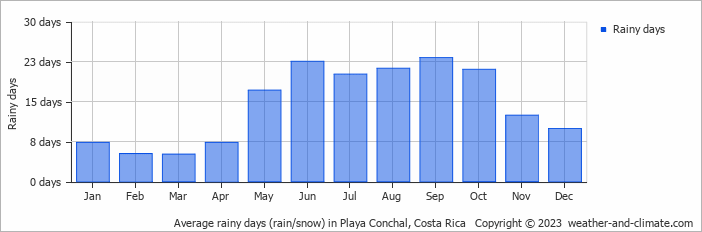
- Most rainy days are in May, June, July, August, September and October.
- On average, September is the most rainy with 23 days of rain/snow.
- On average, March is the driest month with 5 rainy days.
- The average annual number of rainy days is 172.
Current rainfall in Playa Conchal
Tue Dec 24
31°C | 22°C
NE  5 m/s
5 m/s
5 m/s1.3 mm
partly cloudy and chance of slight rain
Wed Dec 25
31°C | 22°C
E 6 m/s
6 m/s2.1 mm
broken clouds and rain
Thu Dec 26
31°C | 22°C
SW 2 m/s
2 m/s1.5 mm
broken clouds and rain