ClimateForecastMayJune >>

Average monthly rainy days in Pincher Creek

The number of days each month with rain, snow and hail in Pincher Creek (Alberta), Canada.

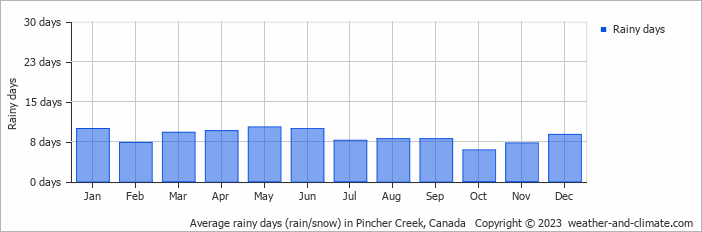
  • On average, May is the most rainy with 10 days of rain/snow.
  • On average, October is the driest month with 5 rainy days.
  • The average annual number of rainy days is 101.

Forecast for Pincher Creek

Wed   May 15
19°C | 5°C
W 36 km/h
broken clouds and no rain

broken clouds and no rain

Thu   May 16
19°C | 7°C
W 43 km/h
0.2 mm
broken clouds and  chance of slight rain

broken clouds and chance of slight rain

Fri   May 17
8°C | 2°C
W 22 km/h
7.1 mm
broken clouds and rain

broken clouds and rain

Interested in more climate information?

This site provides you with all the information you need about the climate in Pincher Creek.

Our site offers climate and forecast data for every country in the world. Are you going to Canada? On this website you can find historical weather averages for many cities in Canada. Not sure yet where to go? We now have a tool which recommends destinations that suit your ideal climate conditions. Find out where to go with our weather planner.