ClimateForecastAprilMay >>

Average monthly rainy days in Piedilago

The number of days each month with rain, snow and hail in Piedilago (Piedmont), Italy.

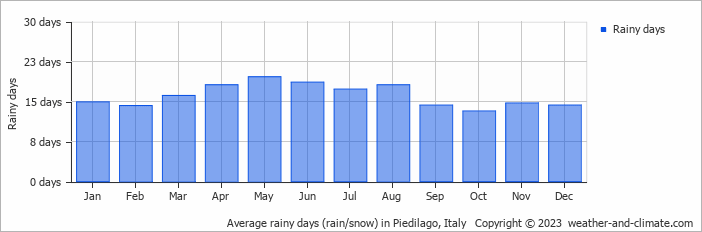
  • Most rainy days are in March, April, May, June, July and August.
  • On average, May is the most rainy with 19 days of rain/snow.
  • On average, October is the driest month with 13 rainy days.
  • The average annual number of rainy days is 193.

Weather Forecasts for Piedilago

Mon   Apr 29
15°C | 8°C
S 4 km/h
1.4 mm
broken clouds and  chance of slight rain

broken clouds and chance of slight rain

Tue   Apr 30
17°C | 9°C
S 7 km/h
9.2 mm
broken clouds and  chance of slight rain

broken clouds and chance of slight rain

Wed   May 01
16°C | 8°C
S 4 km/h
21 mm
overcast and heavy rain

overcast and heavy rain

Interested in more climate information?

Weather and Climate provides you with all the information you need about the climate in Piedilago.

Our site offers climate and forecast data for every country in the world. Are you going to Italy? On this website you can find historical weather averages for many cities in Italy. Not sure yet where to go? We now have a tool which recommends destinations that suit your ideal climate conditions. Find out where to go with our weather planner.