ClimateForecastMayJune >>

Average monthly rainy days in Paravūr

The number of days each month with rain, snow and hail in Paravūr (), India.

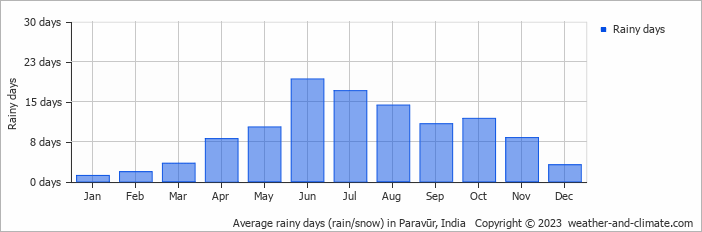
  • Most rainy days are in June and July.
  • Paravūr has dry periods in January and February.
  • On average, June is the most rainy with 19 days of rain/snow.
  • On average, January is the driest month with 1 rainy day.
  • The average annual number of rainy days is 108.

Forecast for Paravūr

Mon   May 06
35°C | 28°C
W 22 km/h
1 mm
broken clouds and  chance of rain

broken clouds and chance of rain

Tue   May 07
36°C | 28°C
W 18 km/h
0.3 mm
partly cloudy and small chance of slight rain

partly cloudy and small chance of slight rain

Wed   May 08
36°C | 28°C
W 18 km/h
6.2 mm
partly cloudy and thunder

partly cloudy and thunder

Interested in more climate information?

This site provides you with all the information you need about the climate in Paravūr.

Our site offers climate and forecast data for every country in the world. Are you going to India? On this website you can find historical weather averages for many cities in India. Not sure yet where to go? We now have a tool which recommends destinations that suit your ideal climate conditions. Find out where to go with our weather planner.