ClimateForecastMayJune >>

Average monthly rainy days in Ollomont

The number of days each month with rain, snow and hail in Ollomont (Valle d'Aosta), Italy.

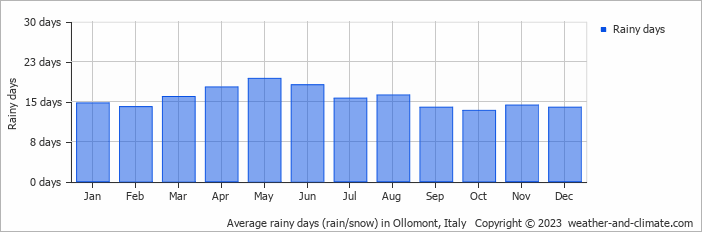
  • Most rainy days are in March, April, May, June, July and August.
  • On average, May is the most rainy with 19 days of rain/snow.
  • On average, October is the driest month with 13 rainy days.
  • The average annual number of rainy days is 186.

Forecast for Ollomont

Fri   May 24
6°C | 0°C
SE 4 km/h
4.6 mm
broken clouds and rain

broken clouds and rain

Sat   May 25
9°C | -1°C
W 4 km/h
partly cloudy and no rain

partly cloudy and no rain

Sun   May 26
13°C | 1°C
W 4 km/h
partly cloudy and no rain

partly cloudy and no rain

Interested in more climate information?

This site provides you with all the information you need about the climate in Ollomont.

Our site offers climate and forecast data for every country in the world. Are you going to Italy? On this website you can find historical weather averages for many cities in Italy. Not sure yet where to go? We now have a tool which recommends destinations that suit your ideal climate conditions. Find out where to go with our weather planner.