Monthly Average Rainy days in Olancha (CA)
The number of days each month with rain, snow and hail in Olancha (California), the United States of America.
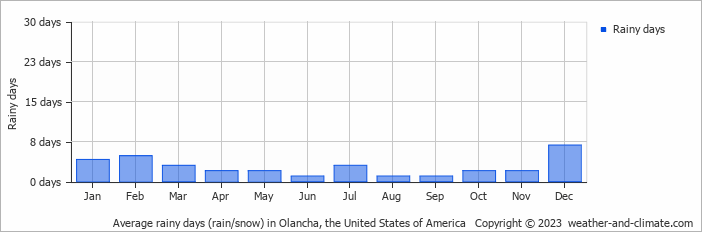
- Olancha has dry periods in April, May, June, August, September, October and November.
- On average, December is the most rainy with 6 days of rain/snow.
- On average, September is the driest month with 1 rainy day.
- The average annual number of rainy days is 32.
Current rainfall in Olancha (CA)
Tue Nov 26
13°C | 2°C
W  36 km/h
36 km/hclear and no rain
Wed Nov 27
12°C | 1°C
NE 7 km/h
7 km/h5.2 mm
broken clouds and small chance of rain
Thu Nov 28
13°C | 1°C
N 7 km/h
7 km/halmost clear and no rain


