Average Rainy - Precipitation days in Oddesund Syd
Oddesund Syd sees 180 days of precipitation annually, totaling to 871 mm of rain/snow. Learn more about it on this page.
Monthly Distribution of Rainy Days
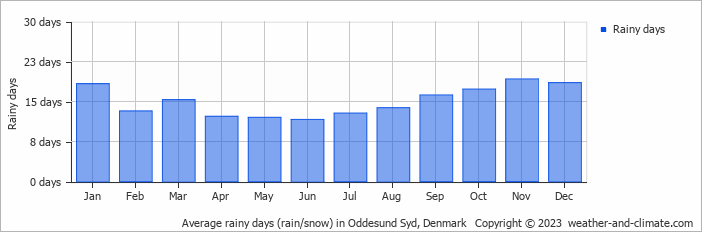
The wettest month is August, with 14 rainy days bringing 92 mm of rain. In contrast, March sees 15 rainy days with 54 mm of rain.
Amsterdam Precipitation Days Compared World Wide
Oddesund Syd's average annual precipitation falls over 180 days. Let's compare this to some popular worldwide tourist destinations:
Las Vegas, USA, gets about 26 precipitation days annually, which is typical for its arid desert climate.
In Bogotá, Colombia, there are around 188 precipitation days annually, typical for its high-altitude tropical climate.
In Barcelona, Spain, there are approximately 121 precipitation days per year, evenly distributed across the year with no extreme wet or dry seasons.
The climate in San Francisco, USA, sees around 70 precipitation days annually, mostly during the winter months.
Osaka, Japan, experiences 198 precipitation days annually, with wetter summers compared to winter.
In Brisbane, Australia, the city averages 123 precipitation days per year, making it wetter than Sydney.
Fun facts about Rain from Around the World
Here are some amazing facts about rain and precipitation worldwide:
- Cherrapunji, India, records an average of 322 rainy days each year. Despite this, the wettest place is Mount Waialeale in Hawaii with 11500 mm annual rainfall.
- The fastest recorded raindrop fell at 18 meters per second during a thunderstorm in Brazil.
- The Atacama Desert in Chile is so dry that some weather stations have never recorded rainfall since their installation.
- The largest recorded raindrop measured 8.8 mm in diameter during a tropical storm on La Réunion Island.
- Some clouds can weigh up to 500,000 tons, that's equivalent to the weight of 100 elephants.
For more detailed information about rainfall patterns in Oddesund Syd, visit our Rainfall & Precipitation page.


