Monthly Average Rainy days in Nosara
The number of days each month with rain, snow and hail in Nosara (Guanacaste), Costa Rica.
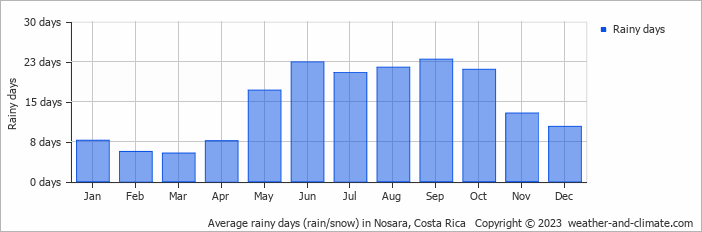
- Most rainy days are in May, June, July, August, September and October.
- On average, September is the most rainy with 22 days of rain/snow.
- On average, March is the driest month with 5 rainy days.
- The average annual number of rainy days is 174.
Current rainfall in Nosara
Sat Dec 21
29°C | 24°C
NE  6 m/s
6 m/s
6 m/s0.8 mm
partly cloudy and thunder
Sun Dec 22
30°C | 23°C
NE 6 m/s
6 m/s0.8 mm
partly cloudy and small chance of rain
Mon Dec 23
29°C | 23°C
NE 6 m/s
6 m/s0.8 mm
partly cloudy and thunder