ClimateForecastAprilMay >>

Average monthly rainy days in Nong Bua

The number of days each month with rain, snow and hail in Nong Bua (Kanchanaburi Province), Thailand.

Average monthly rainy days in Nong Bua,

Feel free to add this climate graph to your website. Click the copy button above.

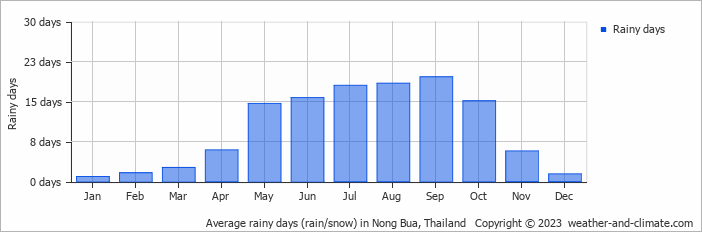
  • Most rainy days are in June, July, August, September and October.
  • Nong Bua has dry periods in January, February and December.
  • On average, September is the most rainy with 19 days of rain/snow.
  • On average, January is the driest month with 0 rainy days.
  • The average annual number of rainy days is 119.

Weather Forecasts for Nong Bua

Wed   Apr 17
40°C | 27°C
SW 14 km/h
0.3 mm
partly cloudy and small chance of slight rain

partly cloudy and small chance of slight rain

Thu   Apr 18
41°C | 26°C
W 14 km/h
clear and no rain

clear and no rain

Fri   Apr 19
41°C | 26°C
W 14 km/h
almost clear and no rain

almost clear and no rain

Interested in more climate information?

Weather and Climate provides you with all the information you need about the climate in Nong Bua.

Our site offers climate and forecast data for every country in the world. Are you going to Thailand? On this website you can find historical weather averages for many cities in Thailand. Not sure yet where to go? We now have a tool which recommends destinations that suit your ideal climate conditions. Find out where to go with our weather planner.