Average Rainy - Precipitation days in Nai Harn Beach
Over the course of the year, Nai Harn Beach experiences 2107 mm of rain across 171 days. On this page you will discover more about the number of precipitation days.
Monthly Distribution of Rainy Days
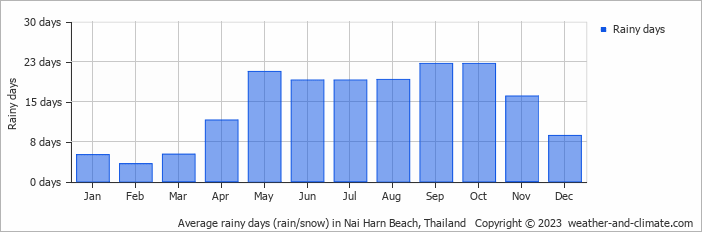
The wettest month is October, with 22 rainy days bringing 301 mm of rain. In contrast, February sees 3 rainy days with 32 mm of rain.
Amsterdam Precipitation Days Compared World Wide
On average, Nai Harn Beach receives over 171 days of precipitation annually. For comparison, here is some data from popular tourist destinations around the world:In Riyadh, Saudi Arabia, there are about 29 precipitation days annually, reflecting its dry desert environment.
In Bogotá, Colombia, there are around 188 precipitation days annually, typical for its high-altitude tropical climate.
Seville, Spain, experiences 103 precipitation days annually, with wet winters and dry summers typical of southern Spain.
The climate in San Francisco, USA, sees around 70 precipitation days annually, mostly during the winter months.
Buenos AiresBuenos Aires, Argentina, has around 92 precipitation days annually, mostly during the summer months.
Melbourne, Australia, has about 120 precipitation days annually, spread fairly evenly throughout the year.
Rain Facts From Around the Globe
Let’s explore more fascinating precipitation records:
- Tutunendo, Colombia, gets about 340 days of rain every year, which arguably makes it the wettest place in the world.
- On Réunion Island, a tropical cyclone generated 1825 mm in just 24 hours.
- Singapore receives thunder on 167 days in the year and is considered one of the most thunderous cities in the world.
- The smallest drops that fall are called drizzle drops, and they have a diameter of 0.5 mm.
- Some heavy storms generate "diamond dust," which consists of very small ice crystals that float in the air.
For more detailed information about rainfall patterns in Nai Harn Beach, visit our Rainfall & Precipitation page.
Current rainfall in Nai Harn Beach


