Monthly Average Rainy days in Murud
The number of days each month with rain, snow and hail in Murud (Maharashtra), India.
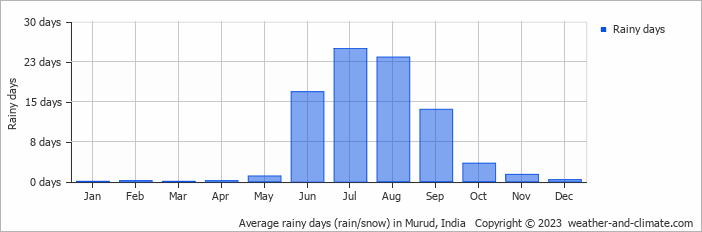
- Most rainy days are in June, July and August.
- Murud has dry periods in January, February, March, April, May, November and December.
- On average, July is the most rainy with 24 days of rain/snow.
- On average, January is the driest month with 0 rainy days.
- The average annual number of rainy days is 84.
Current rainfall in Murud
Wed Dec 25
31°C | 19°C
NW  5 m/s
5 m/s
5 m/sclear and no rain
Thu Dec 26
31°C | 20°C
NW 4 m/s
4 m/sclear and no rain
Fri Dec 27
31°C | 20°C
NW 4 m/s
4 m/sclear and no rain


